
We profiled OmniVoice on an NVIDIA L4 to decide where to focus an inference optimization experiment. Matrix multiplication was the largest category of GPU kernel time, but small operations and attention also contributed substantially. Gaps between kernel launches motivated trying CUDA graphs. This led us to test W4A4 quantization, kernel fusion, and graph replay together, using Nunchaku as a starting point.
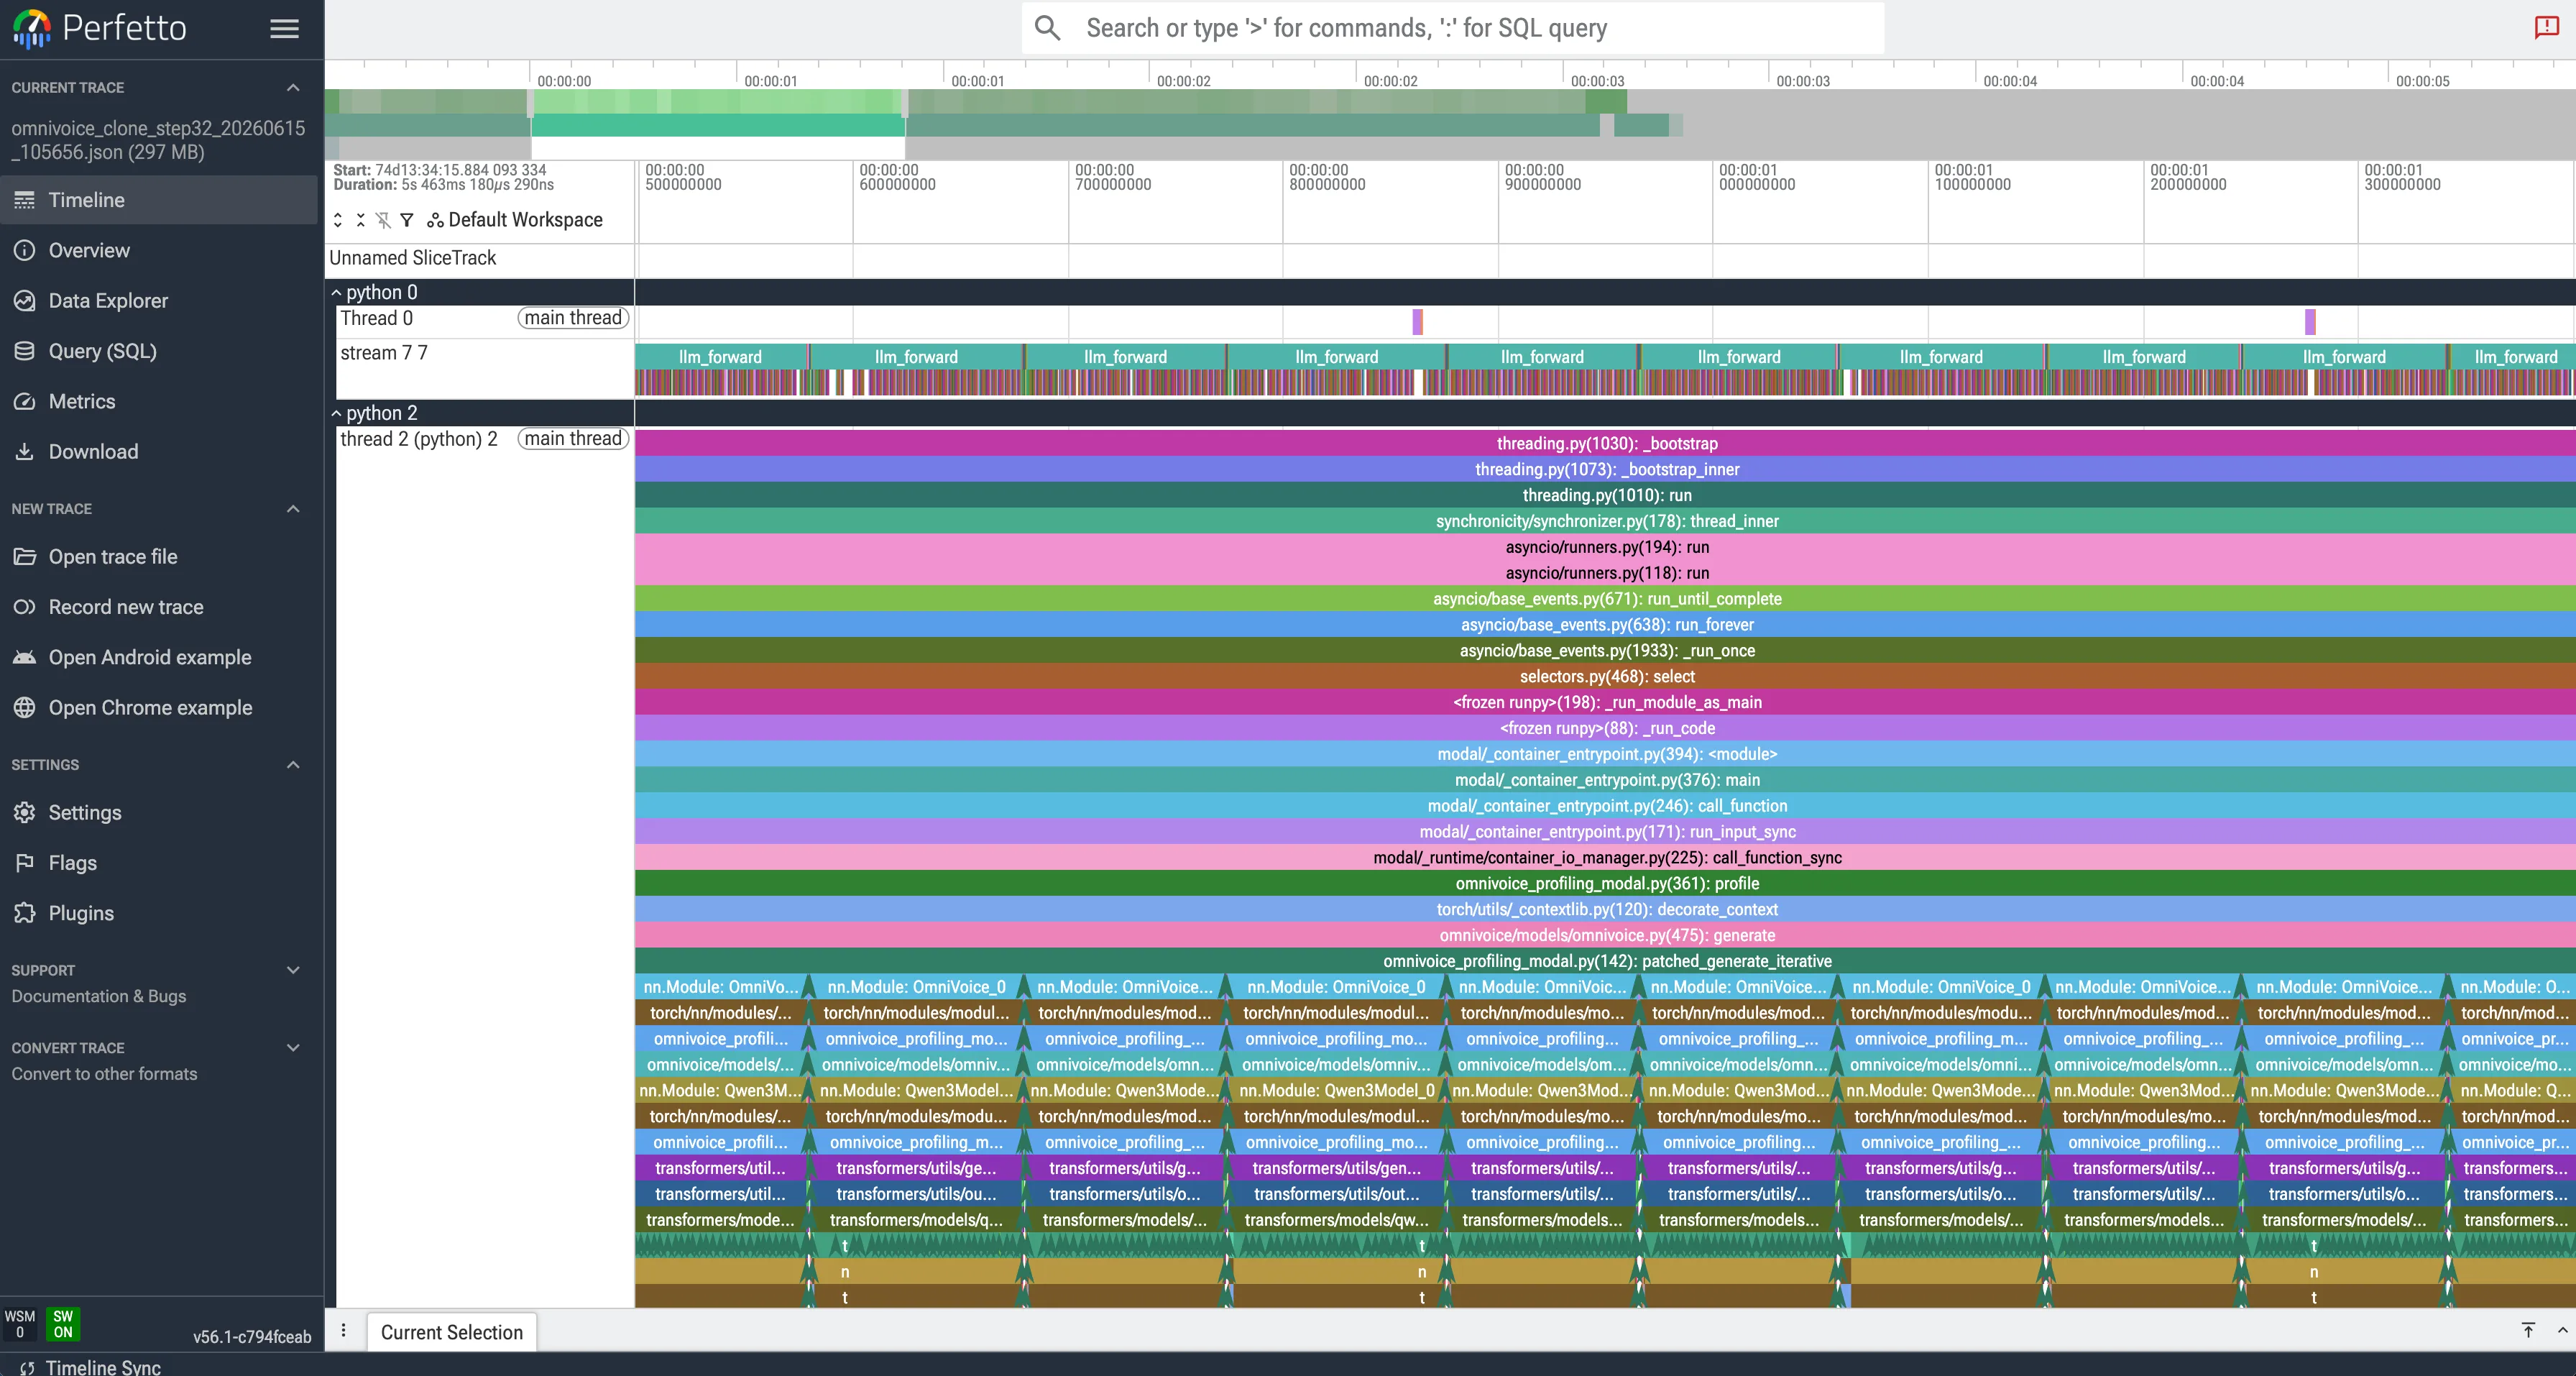
What the profile showed
We traced a complete 32-step voice generation with PyTorch Profiler and inspected it in Perfetto. The trace contained roughly 58,000 CUDA kernel calls. Matrix multiplication accounted for 674 ms, or 36% of GPU kernel time; small add, multiply, and cast operations accounted for 620 ms, or 33%; attention accounted for 393 ms, or 21%. These shares exclude the gaps between kernels.
The gaps suggested testing graph replay to reduce repeated CPU dispatch. However, Python stack tracing adds CPU overhead, so this trace does not establish how much an ordinary run spends waiting. It also does not establish a memory-bandwidth bottleneck.
Why we tried W4A4 and Nunchaku
OmniVoice has 196 backbone Linear layers repeated across 32 generation steps. W4A4 uses 4-bit weights and input activations for the main matrix multiplication path. This was one way to target the largest category in the profile, while fusion could reduce some extra work around those layers. It was a direction to test, rather than a guarantee of faster inference.
We first tried W4A8 through TensorRT LLM, but could not get the ModelOpt export and checkpoint pipeline working with our Qwen3 integration on version 0.18.2. Nunchaku already provided INT4 multiplication, weight packing, and a fused FP16 correction branch, making it a practical design to adapt. Attention remained in FP16.
Our checkpoint differs from SVDQuant
SVDQuant applies smoothing, extracts a small low-rank part with SVD, then quantizes the remaining weights. Our pipeline instead quantizes with GPTQ first and uses rank-16 SVD to approximate part of the difference between the original and quantized weights. The main branch uses INT4, while two small correction tables stay in FP16. Their product has the same shape as the original weights, but retaining only 16 patterns generally cannot reproduce every value.
There are two approximation steps in preparing the weights: GPTQ introduces a quantization error, and rank-16 SVD captures only part of that error. The remaining weight error is the quantization error minus the FP16 correction, rather than two errors simply added together. Runtime activation quantization introduces another approximation.
Our initial SVD-first experiment produced noticeably worse audio, so we selected the GPTQ-first approach based on our own trials. Mistakes in our experimental setup or implementation may have caused that result; we have not ruled them out. This is not evidence that SVDQuant itself is worse.
Combining CUDA kernels and graph replay
We adapted Nunchaku’s fusion design so input quantization and the FP16 down projection share input loads, while INT4 multiplication and the FP16 up projection combine before the final output store. This reduces extra work introduced by the correction branch. It does not imply that all small operations in the profile disappear.
CUDA graphs capture GPU operations once and replay them with less repeated CPU dispatch. We prepared nine input-size buckets covering packed lengths up to 2048 for the captured configuration. Requests outside that coverage require another graph or a fallback. The benchmark measures the combined W4A4, fusion, and CUDA graph path; it does not isolate the speedup from each component.
The result and its limits
On NVIDIA L4, the arithmetic mean RTF across the ten reported voice-cloning samples decreased from 0.1700 with PyTorch FP16 to 0.0596 with W4A4 and CUDA graphs. Dividing those means gives a 2.85× improvement in mean RTF. RTF is inference time divided by generated audio duration: 0.0596 corresponds to about 59.6 ms of inference per second of generated audio on average across these samples.
Generated audio lengths can differ between implementations, so this ratio should not be presented as a directly measured latency speedup for equal-length outputs. RTF also does not measure time to first audio or establish streaming latency.
Voice cloning quality was acceptable in our listening tests, but some segments sounded garbled or had light noise. We have not isolated the cause across weight quantization, activation quantization, and numerical accumulation. Quality consistency remains a work in progress, and suitability for a specific application needs further evaluation.
What we learned from profiling
Profiling helped us choose concrete experiments: try faster Linear layers, fuse related work, and reduce repeated CPU dispatch. Comparing the resulting implementation against the baseline then showed both the RTF improvement and the remaining audio artifacts. The useful process is to measure, test a design, and evaluate performance together with output quality.